Pharmaceutical Elemental Impurities Analysis System - Applications
Energy Dispersive X-ray Fluorescence Spectrometer
Incomparable Analysis Performance
ICH Q3D Class 1 and Class 2A Element Profiles
The following shows the profiles obtained from measurements of the standard mixture solution (XSTC-2046) containing the seven elements in Class 1 and Class 2A. A total of four profiles for the stock solution, 2× diluted solution, 5× diluted solution, and a blank are shown in overlap. The integration time is 1800 seconds for each channel*.

* The same measurement conditions (channel) can be used for measuring elements with similar fluorescent X-ray energies. Therefore, the required analysis time will not equal the integration time multiplied by the number of elements.
For the above-mentioned seven elements, the measurement is performed with three channels. The channels are switched automatically.
ICH Q3D PDE Values
The ICH Q3D specifies the permitted daily exposure (PDE) values for each element respectively for oral drug products, injections, and inhalants. When evaluating elemental impurities in drug products or their constituent components, the specified PDE values must be converted to concentrations. Four options are specified by the regulation for calculating the concentrations. The sensitivity required for analytical instruments will change depending on which option is used, as well as the assumed daily intake in grams for the applicable drug product.
| Element | Class | PDE Value for Oral Drug Products μg/day |
PDE Value for Injections μg/day |
PDE Value for Inhalants μg/day |
|---|---|---|---|---|
| Cd | 1 | 5 | 2 | 2 |
| Pb | 1 | 5 | 5 | 5 |
| As | 1 | 15 | 15 | 2 |
| Hg | 1 | 30 | 3 | 1 |
| Co | 2A | 50 | 5 | 3 |
| V | 2A | 100 | 10 | 1 |
| Ni | 2A | 200 | 20 | 5 |
| Tl | 2B | 8 | 8 | 8 |
| Au | 2B | 100 | 100 | 1 |
| Pd | 2B | 100 | 10 | 1 |
| Ir | 2B | 100 | 10 | 1 |
| Os | 2B | 100 | 10 | 1 |
| Element | Class | PDE Value for Oral Drug Products μg/day |
PDE Value for Injections μg/day |
PDE Value for Inhalants μg/day |
|---|---|---|---|---|
| Rh | 2B | 100 | 10 | 1 |
| Ru | 2B | 100 | 10 | 1 |
| Se | 2B | 150 | 80 | 130 |
| Ag | 2B | 150 | 10 | 7 |
| Pt | 2B | 100 | 10 | 1 |
| Li | 3 | 550 | 250 | 25 |
| Sb | 3 | 1200 | 90 | 20 |
| Ba | 3 | 1400 | 700 | 300 |
| Mo | 3 | 3000 | 1500 | 10 |
| Cu | 3 | 3000 | 300 | 30 |
| Sn | 3 | 6000 | 600 | 60 |
| Cr | 3 | 11000 | 1100 | 3 |
Converting PDEs to Concentration Limits
Option 1
- Assuming a daily intake of 10 g of the drug product, conversion is made to the maximum permissible concentration for all constituent components of the drug product, using the maximum permissible intake.
Option 2a
- Based on the actual daily intake, conversion is made to the maximum permissible concentration for all constituent components of the drug product, using the maximum permissible intake.
Option 2b
- Based on measured values for each constituent component in the drug product, any expected maximum (permissible) concentrations are arbitrarily set.
Option 3
- Based on the actual daily intake, conversion is made to the maximum permissible concentration in the finished drug product.
Relationship Between the Lower Detection Limit and the Integration Time
The lower detection limit differs depending on the measured element and the sample matrix. If heavy elements are contained in a light element matrix, a lower detection limit of several micrograms per gram to several sub-micrograms per gram will be obtained. It is also possible to improve the lower detection limit by extending the integration time. Theoretically, if the integration time is extended by a factor of four, the lower detection limit will be 1/2 the original value, and if the integration time is extended by a factor of nine, the lower detection limit will be 1/3 the original value.


Example of the Analysis of a Micro Contaminant
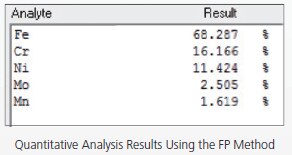
The EDX-7000 is useful not only for analysis of elemental impurities but also for analysis to identify contaminants. Using the sample observation camera and collimator allows easy analysis even for micro contaminants. The following data is from analyzing micro metallic contaminants (simulated sample) on the order of a few hundred micrometers in size. In addition to the main constituents (Fe, Cr, and Ni), Cu and Mo are also detected at 1 wt% or less.


