Intro to Mass Spectrometry Imaging (MSI)
| Navigation |
|---|
| MALDI Based Mass Spectrometry Imaging |
| Sample Preparation and Storage |
| Sample Pretreatment |
| Matrix Choice and Application |
| Data Acquisition and Analysis |
| Multimodal Imaging |
MALDI Based Mass Spectrometry Imaging
Mass spectrometry imaging (MSI) is a technique that combines sensitive mass spectrometry with spatial resolution.1,2 With this technique each pixel of a generated image represents a unique mass spectrum collected from an analyzed sample. Mass spectrometry imaging was first introduced through the analysis of semiconductor surfaces using secondary ion mass spectrometry (SIMS) to identify trace compounds in finished products.3 SIMS has been traditionally used for imaging of inorganic materials, with less interest in analyzing of organic and biological samples.4 Matrix assisted laser desorption/ionization time-of-flight mass spectrometry (MALDI-TOF-MS) has long been utilized for the detection of biological materials, Franz Hillenkamp, and his colleague Michael Karas first demonstrated the use of that MALDI to analyze large biopolymers.5 Kochi Tanaka developed a novel MALDI matrix combination using an ultra-fine cobalt metal powder with glycerol dissolved in organic solvents as a matrix to detect large biomolecules without breaking them apart.6 These advances in MALDI-TOF-MS led to its use in MSI experiments. In 1997, Richard M. Caprioli and colleagues demonstrated that MALDI based MSI could be utilized to visualize the distribution of different biomolecules in biological cells and tissues. 7–12 This work set a precedent for others to study the availability of biomolecules at a cellular level.9,13–17 The general workflow for MSI is shown in Figure 1.
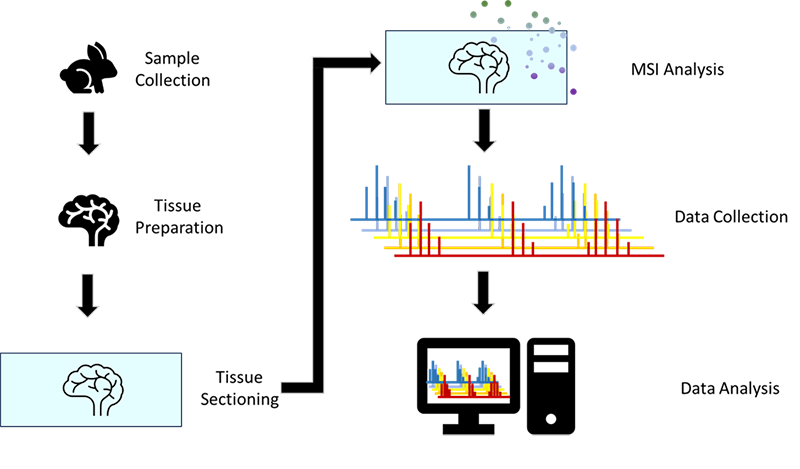
Figure 1. Overview of MSI sample preparation and data acquisition process.
Sample Preparation and Storage
Biological tissue samples are commonly used for MSI experiments, special care is required to preserve the tissue to have access to different analyte classes. This can be a challenging process, sample collection should be as soon as possible after the death of the animal, or surgical separation from the source. Tissue samples need to be stored at -80 °C until cryosectioned to preserve molecule localization and prevent sample deterioration. For optimal results the sample should not have physical damage or prolonged exposure to environmental factors like heat or air for an extended time. Fresh frozen tissue has been considered to be optimal for MALDI MSI for detection of most common biomolecules due to the lack of external interference from tissue processing steps.18,19 Formalin-fixed paraffin embedded (FFPE) tissue is favored in clinical settings, but comes with additional challenges for MSI as it binds to amino acid residues such as lysine, tyrosine, asparagine, arginine and glutamine, removes lipids and metabolites from the tissue during processing.20 This binding will impact the detected masses and potentially the ability of specific peptides/proteins to ionize.18,20 To utilize FFPE tissue, samples need to be rehydrated and deparaffinized to regain access to glycans and peptides.21 MSI is not limited to analysis of biological tissues, plant tissue can also be analyzed. Plant roots, stems, seeds, and leaves can be sectioned or imprinted for analysis.22,23
In most cases, an optimal cutting temperature media (OCT) is used to adhere the sample onto the cryostat specimen object disk. Choosing a mass spectrometry silent OCT media such as Shandon M-1 embedding matrix is important to prevent signal interference.24 MSI experiments have been conducted on tissues varying from 5-20 µm sections, 10 µm thick sections are the most common for analysis.15,25 Thicker tissue samples result in an insulating effect, reducing signal intensity. Samples should be mounted on a conductive surface, either on a stainless-steel plate or indium tin oxide (ITO) coated glass microscope slide. Prepared samples can be brought to room temperature after sectioning for matrix application or stored at -80 °C until analysis.
Recommended Products for Sample Preparation


Sample Pretreatment
Depending on the target of interest, sample pretreatment can be useful to simplify analyte detection. Techniques such as on tissue chemical derivatization (OTCD)26 or tissue washing27 can assist in detection of analytes that are impacted by ionization suppression, low concentrations or matrix interference. Washing a tissue sample before analysis is commonly performed to remove endogenous lipids and metabolites to increase the sensitivity of peptide and protein detection. This is done through a series of different organic solvent washes, often including a wash using Carnoy’s solution (ethanol: chloroform: acetic acid) (60:30:10). After performing a tissue wash, the sample can be coated with enzyme to digest peptides and proteins to aid in detection before matrix application.
OTCD techniques allow for various chemical reactions to take place on the surface of the tissue to assist in analyte detection. Girard’s reagent T & P are used to modify aldehydes and ketones to create a hydrazone. This modification can allow for easier detection of various compounds using MSI. Figure 2 shows detection of fatty acids modified with N,N,N trimethyl-2-(piperazin-1-yl)ethan-1aminium iodide (TMPA) using OTCD. OTCD was performed using the iMLayer Aero to automate solution application. TMPA specifically reacts with carboxylic acids to form an amide bond, this reaction helps to improve the detection of various fatty acids.28
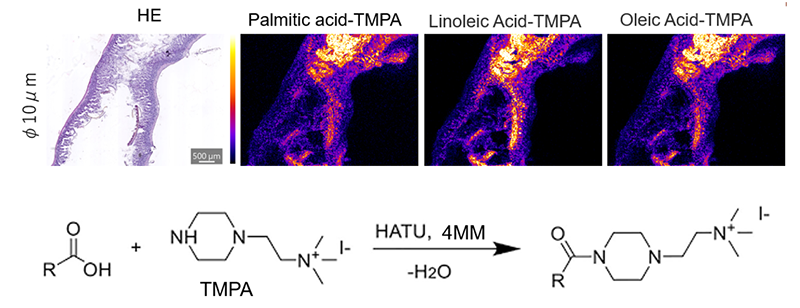
Figure 2. Murine small intestine derivatized with TMPA to aid in the detection of various fatty acids. Reaction scheme of TMPA with carboxylic acid to form amide bond. (Kubo, A. et.al. ASMS 2024)
Matrix Choice and Application
Before MSI analysis, a suitable matrix needs to be selected to visualize analytes of interest. There are various criteria that need to be considered when making a choice for matrix. The first consideration is if the desired matrix compound has a strong absorbance at the wavelength the laser iridates at (nitrogen laser light, 337 nm, Nd:YAG laser, 355 nm29), this is critical for energy transfer from the matrix to analyte for proper ionization and subsequent detection. Additionally, the matrix should be non-volatile under high vacuum environments to allow for prolonged sample analysis. Second, the matrix chosen should be suitable for the detection of the compound of interest, for example, 9-aminoacridine (9-AA) for lipids30-33, α-cyano-4-hydroxycinnaminic acid (CHCA) or 2,5-dihydroxybenzoic acid (DHB) for metabolites and peptides. 18,20,27,34,35 Once an analyte and matrix have been identified there are two different approaches to matrix application, aerosol deposition from a matrix solution or sublimation of dry matrix onto the sample.36,37When choosing a matrix application technique there is also the consideration of the resulting matrix crystal size, the smaller the resulting crystals the higher the spatial resolution in analysis.36 Aerosol deposition of a matrix solution can be conducted with an air brush or automatic sprayer, these techniques result in the formation of larger matrix crystals. Sublimation results in a more uniform matrix coating and smaller crystals.19,37 To achieve a higher spatial resolution, smaller matrix crystals are necessary. While some compounds may become more visible after addition of a matrix solution when compared to sublimation application. Both properties need to be considered when making a choice for matrix application.
Data Acquisition and Analysis
After matrix application is complete, an image of the sample slide is necessary for data acquisition. Depending on the instrument utilized, a high-resolution sample image may need to be obtained prior to matrix application and analysis unless a microscope and camera is within the instrument. There are two main classes of instruments on the market for MSI, high vacuum MALDI and atmospheric pressure MALDI (AP-MALDI) based instruments.16 Each instrument class comes with advantages and limitations for analysis, atmospheric pressure systems can result in spatial resolution on the order of 1.4-3 µm 38 while high vacuum systems are limited to 10-100 µm8 spatial resolution. High vacuum MALDI can be advantageous for detection of high mass peptides and proteins while AP-MALDI can detect volatile compounds that would otherwise be lost under vacuum. Method development is an important process for each tissue type to ensure detection of desired analytes. Each system has capabilities and limitations depending on the ion source and mass analyzer within the instrument, for this reason each system needs to be optimized for the desired analyte and tissue type.
Data analysis software enables users to take raw mass spectrum data and generate meaningful images that represent the spatial information of the sample analyzed. The general workflow for data processing includes (1) importing raw data, (2) pre-processing/normalization (3) peak picking (4) statistical analysis (5) identification and quantification.16 Through this workflow an important step is data normalization, this helps to reduce the influence of heterogenous matrix crystallization and ion source degradation. Most commonly this is done through by dividing the mass intensity by the sum of all intensities across the spectrum to generate a total ion count (TIC) spectrum.39 Once a TIC spectrum is generated, a peak picking algorithm is applied to distinguish between signal peaks and background noise.40 After processing, statistical analyses can be utilized to analyze at least two groups and gain a deeper understanding of how compounds differ between samples. Whether this is through a principal component analysis (PCA)41, or through a machine learning42 algorithm these tools provide researchers another way to investigate their data. Figure 3 shows the main page of IMAGEREVEAL MS showing the data library, spectrum data, and generated images.
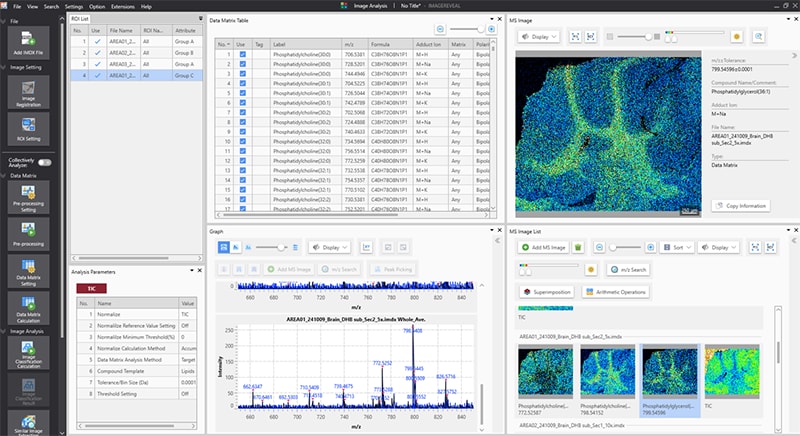
Figure 3. Data analysis software IMAGEREVEAL MS showing data of mouse brain for lipid analysis.
Recommended Products for Data Acquisition and Analysis


Multimodal Imaging
Mass Spectrometry Imaging has allowed for different research questions to be targeted. Imaging samples are complex and can require multiple types of analysis to have a full understanding of the complex molecular composition. Multimodal imaging has been utilized to study multiple analyte classes within a single tissue sample. A common route for multimodal imaging involves using fluorescence imaging before MSI analysis to provide a framework for data analysis. There are multiple routes for multimodal imaging to further enhance MSI data.
One multimodal imaging technique involves using antibodies functionalized with peptide markers to locate and detect various analytes. This immunohistochemical approach can be used to detect numerous proteins and peptides.43 A key advantage of using indirect analysis using the antibody tags is that it allows for analysis over a lower mass range. Typically, proteins are identified from 6 kDa to 100 kDa, where the peptide tags are within the 1-2 kDa range, allowing for a variety of instruments to be used for this level of analysis. Figure 4 shows MSI data using an AmberGen Miralys 20-plex probe panel on a section of human tonsil. The probes provide a method of visualization of high molecular weight targets without needing to detect their intact mass. With this technique, tissue samples can be analyzed before antibody addition for lipids and metabolites (for fresh frozen samples) and after for trypsin digested peptides, adding another layer of data.
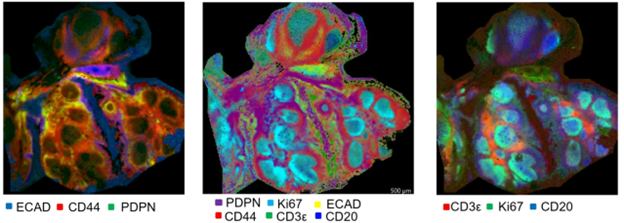
Figure 4. IHC analysis of different proteins in human tonsil tissue using Ambergen kit. Images were generated using the MALDI-8020, benchtop MALDI . (Jones, C. et al. ASMS 2024)
Another route for multimodal imaging combines subsequent analysis with MALDI based imaging for detection of lipids and metabolites and laser ablation inductively coupled plasma mass spectrometry (LA-ICP-MS) for detection of specific elements. In tandem these techniques provide a complimentary analysis of a complex molecular composition. Figure 5A shows MSI data of lipids in murine kidneys. Figure 5B shows subsequent analysis of murine kidney samples with LA-ICP-MS, showing elemental differences between the groups.
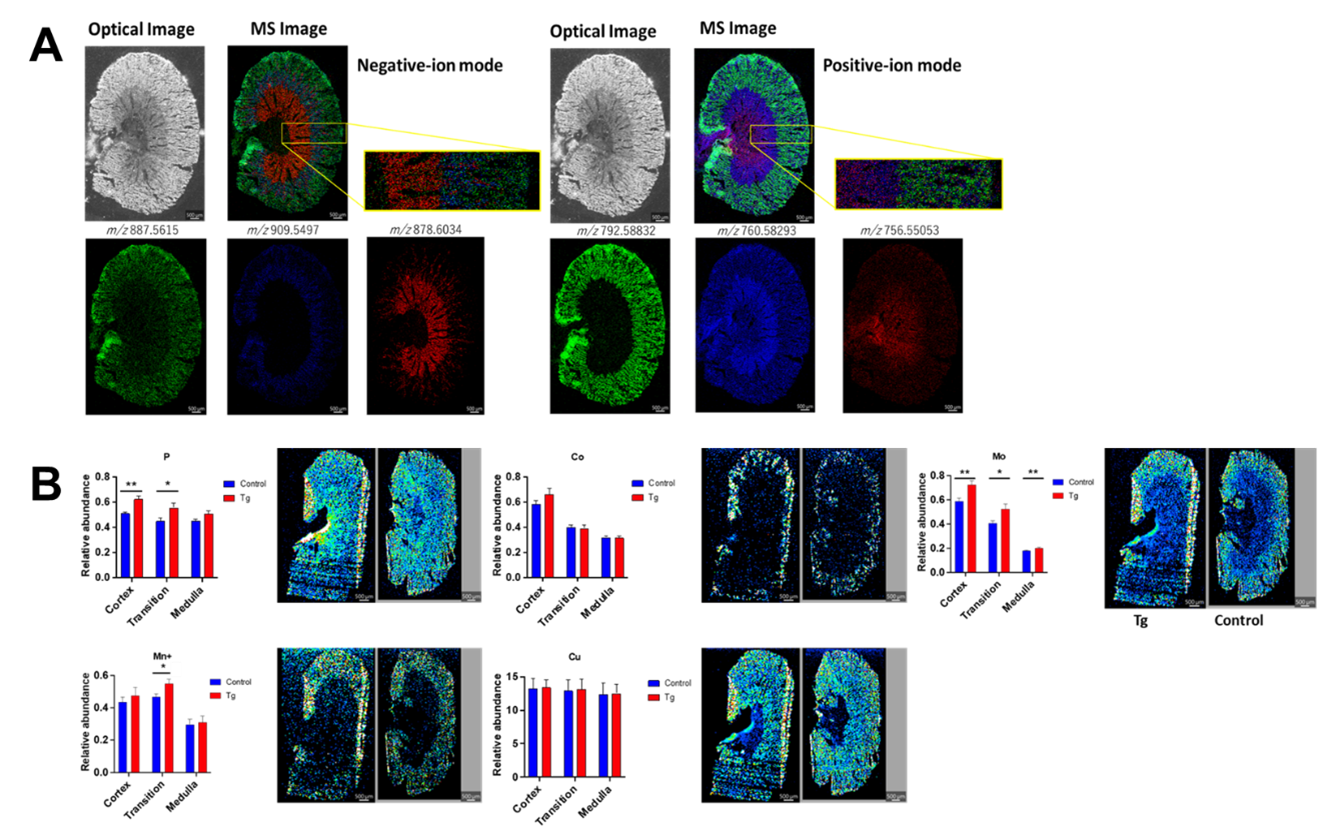
Figure 5. (A) AP-MALDI imaging of murine kidney sections, highlighting different lipids in the medulla, cortex and cortex medulla transition regions.44 (B) LA-ICP-MS images generated from control and disease murine models. (Gordillo, R. et.al. ASMS 2024)
[1] Rubakhin, S. S.; Sweedler, J. V. A Mass Spectrometry Primer for Mass Spectrometry Imaging. Methods in Molecular Biology 2010, 656, 21–49. https://doi.org/10.1007/978-1-60761-746-4_2.
[2] Introduction to Spatial Mapping of Biomolecules by Imaging Mass Spectrometry; Elsevier, 2021. https://doi.org/10.1016/c2018-0-03962-6.
[3] Benninghoven, Alfred.; Sichtermann, W. K. Detection, Identification, and Structural Investigation of Biologically Important Compounds by Secondary Ion Mass Spectrometry. Anal Chem 1978, 50 (8), 1180–1184. https://doi.org/10.1021/ac50030a043.
[4] Hammond, J. S. Comparison of SIMS and MALDI for Mass Spectrometric Imaging. In Imaging Mass Spectrometry; Springer Japan, 2010; pp 235–257. https://doi.org/10.1007/978-4-431-09425-8_18.
[5] Karas, Michael.; Hillenkamp, Franz. Laser Desorption Ionization of Proteins with Molecular Masses Exceeding 10,000 Daltons. Anal Chem 1988, 60 (20), 2299–2301. https://doi.org/10.1021/ac00171a028.
[6] Tanaka, K.; Waki, H.; Ido, Y.; Akita, S.; Yoshida, Y.; Yoshida, T.; Matsuo, T. Protein and Polymer Analyses up to m/z 100 000 by Laser Ionization Time‐of‐flight Mass Spectrometry. Rapid Communications in Mass Spectrometry 1988, 2 (8), 151–153. https://doi.org/10.1002/rcm.1290020802.
[7] Caprioli, R. M.; Farmer, T. B.; Gile, J. Molecular Imaging of Biological Samples: Localization of Peptides and Proteins Using MALDI-TOF MS. Anal Chem 1997, 69 (23), 4751–4760. https://doi.org/10.1021/ac970888i.
[8] Spraggins, J. M.; Djambazova, K. V; Rivera, E. S.; Migas, L. G.; Neumann, E. K.; Fuetterer, A.; Suetering, J.; Goedecke, N.; Ly, A.; Van De Plas, R.; Caprioli, R. M. High-Performance Molecular Imaging with MALDI Trapped Ion-Mobility Time-of-Flight (TimsTOF) Mass Spectrometry HHS Public Access. Anal Chem 2019, 91 (22), 14552–14560. https://doi.org/10.1021/acs.anal-chem.9b03612.
[9] Norris, J. L.; Caprioli, R. M. Imaging Mass Spectrometry: A New Tool for Pathology in a Molecular Age. Proteomics Clin Appl 2013, 7 (11–12), 733–738. https://doi.org/10.1002/prca.201300055.
[10] Norris, J. L.; Caprioli, R. M. Analysis of Tissue Specimens by Matrix-Assisted Laser Desorption/Ionization Imaging Mass Spectrometry in Biological and Clinical Research. Chemical Reviews. April 10, 2013, pp 2309–2342. https://doi.org/10.1021/cr3004295.
[11] Casadonte, R.; Caprioli, R. M. Proteomic Analysis of Formalin-Fixed Paraffin-Embedded Tissue by MALDI Imaging Mass Spectrometry. Nat Protoc 2011, 6 (11), 1695–1709. https://doi.org/10.1038/nprot.2011.388.
[12] Yang, J.; Caprioli, R. M. Matrix Sublimation/Recrystallization for Imaging Proteins by Mass Spectrometry at High Spatial Resolution. Anal Chem 2011, 83 (14), 5728–5734. https://doi.org/10.1021/ac200998a.
[13] Buchberger, A. R.; DeLaney, K.; Johnson, J.; Li, L. Mass Spectrometry Imaging: A Review of Emerging Advancements and Future Insights. Analytical Chemistry. American Chemical Society January 2, 2018, pp 240–265. https://doi.org/10.1021/acs.analchem.7b04733.
[14] Francese, S.; Dani, F.; Traldi, P.; Mastrobuoni, G.; Pieraccini, G.; Moneti, G. MALDI Mass Spectrometry Imaging, from Its Origins up to Today: The State of the Art. Comb Chem High Throughput Screen 2009, 12 (2), 156–174. https://doi.org/10.2174/138620709787315454.
[15] Shimma, S.; Sugiura, Y. Effective Sample Preparations in Imaging Mass Spectrometry. Mass Spectrometry 2014, 3 (Special_Issue), S0029–S0029. https://doi.org/10.5702/massspectrometry.S0029.
[16] Dilmetz, B. A.; Lee, Y. R.; Condina, M. R.; Briggs, M.; Young, C.; Desire, C. T.; Klingler-Hoffmann, M.; Hoffmann, P. Novel Technical Developments in Mass Spectrometry Imaging in 2020: A Mini Review. Analytical Science Advances. John Wiley and Sons Inc April 1, 2021, pp 225–237. https://doi.org/10.1002/ansa.202000176.
[17] Aichler, M.; Walch, A. MALDI Imaging Mass Spectrometry: Current Frontiers and Perspectives in Pathology Research and Practice. Laboratory Investigation 2015, 95 (4), 422–431. https://doi.org/10.1038/labinvest.2014.156.
[18] Angel, P. M.; Norris-Caneda, K.; Drake, R. R. In Situ Imaging of Tryptic Peptides by MALDI Imaging Mass Spectrometry Using Fresh-Frozen or Formalin-Fixed, Paraffin-Embedded Tissue. Curr Protoc Protein Sci 2018, 94 (1). https://doi.org/10.1002/cpps.65.
[19] Dong, Y.; Li, B.; Malitsky, S.; Rogachev, I.; Aharoni, A.; Kaftan, F.; Svatoš, A.; Franceschi, P. Sample Preparation for Mass Spectrometry Imaging of Plant Tissues: A Review. Front Plant Sci 2016, 7 (FEB2016). https://doi.org/10.3389/fpls.2016.00060.
[20] Ly, A.; Longuespée, R.; Casadonte, R.; Wandernoth, P.; Schwamborn, K.; Bollwein, C.; Marsching, C.; Kriegsmann, K.; Hopf, C.; Weichert, W.; Kriegsmann, J.; Schirmacher, P.; Kriegsmann, M.; Deininger, S. Site‐to‐Site Reproducibility and Spatial Resolution in MALDI–MSI of Peptides from Formalin‐Fixed Paraffin‐Embedded Samples. Proteomics Clin Appl 2019, 13 (1). https://doi.org/10.1002/prca.201800029.
[21] Shimma, S.; Sugiura, Y. Effective Sample Preparations in Imaging Mass Spectrometry. Mass Spectrometry 2014, 3 (Special_Issue), S0029–S0029. https://doi.org/10.5702/massspectrometry.s0029.
[22] Insight into Plant Spatial Omics: Mass Spectrometry Imaging; Wang, X., Liu, L., Han, J., Li, Z., Li, B., Wan, Y., Eds.; Frontiers Research Topics; Frontiers Media SA, 2023. https://doi.org/10.3389/978-2-8325-3403-8.
[23] Yin, Z.; Huang, W.; Fernie, A. R.; Yan, S. Mass Spectrometry Imaging Techniques: A Versatile Toolbox for Plant Metabolomics. Trends in Plant Science. Elsevier Ltd February 1, 2023, pp 250–251. https://doi.org/10.1016/j.tplants.2022.10.009.
[24] Tressler, C.; Tilley, S.; Yang, E.; Donohue, C.; Barton, E.; Creissen, A.; Glunde, K. Factorial Design to Optimize Matrix Spraying Parameters for MALDI Mass Spectrometry Imaging. J Am Soc Mass Spectrom 2021, 32 (12), 2728–2737. https://doi.org/10.1021/jasms.1c00081.
[25] Buchberger, A. R.; Vu, N. Q.; Johnson, J.; DeLaney, K.; Li, L. A Simple and Effective Sample Preparation Strategy for MALDI-MS Imaging of Neuropeptide Changes in the Crustacean Brain Due to Hypoxia and Hypercapnia Stress. J Am Soc Mass Spectrom 2020, 31 (5), 1058–1065. https://doi.org/10.1021/jasms.9b00107.
[26] Harkin, C.; Smith, K. W.; Cruickshank, F. L.; Logan Mackay, C.; Flinders, B.; Heeren, R. M. A.; Moore, T.; Brockbank, S.; Cobice, D. F. On-Tissue Chemical Derivatization in Mass Spectrometry Imaging. Mass Spectrometry Reviews. John Wiley and Sons Inc September 1, 2022, pp 662–694. https://doi.org/10.1002/mas.21680.
[27] Høiem, T. S.; Andersen, M. K.; Martin-Lorenzo, M.; Longuespée, R.; Claes, B. S. R.; Nordborg, A.; Dewez, F.; Balluff, B.; Giampà, M.; Sharma, A.; Hagen, L.; Heeren, R. M. A.; Bathen, T. F.; Giskeødegård, G. F.; Krossa, S.; Tessem, M. B. An Optimized MALDI MSI Protocol for Spatial Detection of Tryptic Peptides in Fresh Frozen Prostate Tissue. Proteomics 2022, 22 (10). https://doi.org/10.1002/pmic.202100223.
[28] Sun, C.; Liu, W.; Geng, Y.; Wang, X.; On-Tissue Derivatization Strategy for Mass Spectrometry Imaging of Carboxyl-Containing Metabolites in Biological Tissues. Anal Chem 2020, 92 (18), 12126-12131. https://doi.org/10.1021/acs.analchem.0c02303
[29] Zhang, G.; Annan, R. S.; Carr, S. A.; Neubert, T. A. Overview of Peptide and Protein Analysis by Mass Spectrometry. Curr Protoc Mol Biol 2014, 2014, 10.21.1-10.21.30. https://doi.org/10.1002/0471142727.mb1021s108.
[30] Wang, H. Y. J.; Liu, C. Bin; Wu, H. W. A Simple Desalting Method for Direct MALDI Mass Spectrometry Profiling of Tissue Lipids. J Lipid Res 2011, 52 (4), 840–849. https://doi.org/10.1194/jlr.D013060.
[31] Leopold, J.; Popkova, Y.; Engel, K. M.; Schiller, J. Recent Developments of Useful MALDI Matrices for the Mass Spectrometric Characterization of Lipids. Biomolecules. MDPI AG December 1, 2018. https://doi.org/10.3390/biom8040173.
[32] Carter, C. L.; Jones, J. W.; Farese, A. M.; Macvittie, T. J.; Kane, M. A. Inflation-Fixation Method for Lipidomic Mapping of Lung Biopsies by Matrix Assisted Laser Desorption/Ionization-Mass Spectrometry Imaging. Anal Chem 2016, 88 (9), 4788–4794. https://doi.org/10.1021/acs.analchem.6b00165.
[33] Pietrowska, M.; Gawin, M.; Polańska, J.; Widłak, P. Tissue Fixed with Formalin and Processed without Paraffin Embedding Is Suitable for Imaging of Both Peptides and Lipids by MALDI-IMS. Proteomics 2016, 16 (11–12), 1670–1677. https://doi.org/10.1002/pmic.201500424.
[34] Carlred, L.; Michno, W.; Kaya, I.; Sjövall, P.; Syvänen, S.; Hanrieder, J. Probing Amyloid-β Pathology in Transgenic Alzheimer’s Disease (TgArcSwe) Mice Using MALDI Imaging Mass Spectrometry. J Neurochem 2016, 469–478. https://doi.org/10.1111/jnc.13645.
[35] Keough, T.; Lacey, M. P.; Strife, R. J. Atmospheric Pressure Matrix-Assisted Laser Desorption/ Ionization Ion Trap Mass Spectrometry of Sulfonic Acid Derivatized Tryptic Peptides. Rapid Communications in Mass Spectrometry 2001, 15 (23), 2227–2239. https://doi.org/10.1002/rcm.499.
[36] Gemperline, E.; Rawson, S.; Li, L. Optimization and Comparison of Multiple MALDI Matrix Application Methods for Small Molecule Mass Spectrometric Imaging. Anal Chem 2014, 86 (20), 10030–10035. https://doi.org/10.1021/ac5028534.
[37] Shanta, S. R.; Kim, T. Y.; Hong, J. H.; Lee, J. H.; Shin, C. Y.; Kim, K. H.; Kim, Y. H.; Kim, S. K.; Kim, K. P. A New Combination MALDI Matrix for Small Molecule Analysis: Application to Imaging Mass Spectrometry for Drugs and Metabolites. Analyst 2012, 137 (24), 5757–5762. https://doi.org/10.1039/c2an35782h.
[38] Kompauer, M.; Heiles, S.; Spengler, B. Atmospheric Pressure MALDI Mass Spectrometry Imaging of Tissues and Cells at 1.4-Μm Lateral Resolution. Nat Methods 2016, 14 (1), 90–96. https://doi.org/10.1038/nmeth.4071.
[39] Alexandrov, T. MALDI Imaging Mass Spectrometry: Statistical Data Analysis and Current Computational Challenges. BMC Bioinformatics 2012, 13 (S16), S11. https://doi.org/10.1186/1471-2105-13-S16-S11.
[40] Alexandrov, T.; Bartels, A. Testing for Presence of Known and Unknown Molecules in Imaging Mass Spectrometry. Bioinformatics 2013, 29 (18), 2335–2342. https://doi.org/10.1093/bioinformatics/btt388
[41] Broersen, A.; van Liere, R.; Altelaar, A. F. M.; Heeren, R. M. A.; McDonnell, L. A. Automated, Feature-Based Image Alignment for High-Resolution Imaging Mass Spectrometry of Large Biological Samples. J Am Soc Mass Spectrom 2008, 19 (6), 823–832. https://doi.org/10.1016/j.jasms.2008.02.015.
[42] LeCun, Y.; Bengio, Y.; Hinton, G. Deep Learning. Nature 2015, 521 (7553), 436–444. https://doi.org/10.1038/nature14539.
[43] Yagnik, G.; Liu, z.; Rothschild, K.; Lim, M. Highly Multiplexed Immunohistochemical MALDI-MS Imaging of Biomarkers in Tissues. J Am Soc Mass Spectrom 2021,32 (4), 997-988. https://doi.org/10.1021/jasms.0c00473
[44] Onodera, T.; Wang, M.; Rutkowski, J.; Deja, S.; Chen, S.; Balzer, M.; Kim, D.; Sun, X.; An, Y.; Field. B.; Lee, C.; Matsuo, E.; Mizerska, M.; Sanjana, I.; Fujiwara, N.; Kusmini, C.; Gordillo, R.; Gautron, L.; Marciano, D.; Hu, M.; Burgess, S.; Susztak, K.; Moe, O.; Scherer, P. Endogenous renal adiponectin drives gluconeogenesis through enhancing pyruvate and fatty acid utilization. Nat Comm 2023, 14 (1). https://doi.org/10.1038/s41467-023-42188-4